TM Error
Timing Model Tracking Error
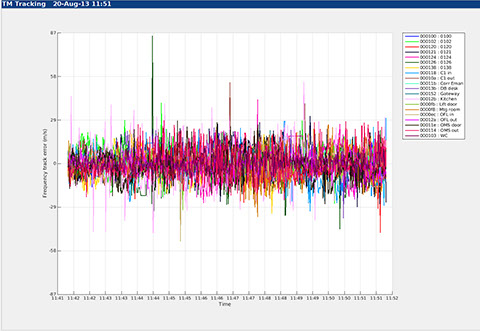
This technical chart indicates the quality of the Timing Model tracking for each node on the chosen display set.
Good tracking lies in the range -1.0 to 0.4 on the Y axis. The Y axis is logarithmic, the value being the logarithm of the mean timing error in metres. Therefore values around -1 indicate errors around 0.1m and values around 0 indicate errors around 1 metre.
Spikes and tracks outside the normal band indicate potentially poor tracking. Short excursions are not a problem and regularly arise from measurement errors; interference and sometimes other environmental effect.
Traces that lie outside the inner third for an extended period of time indicate failure to track correctly.
This chart is generally useful in a subjective sense as an indicator of overall system tracking quality. It can occasionally highlight specific problems with a particular device.
TM Tracking in ToF Systems
In Time-of-Flight systems, such as Nanotron swarm bee, the TM Tracking chart has an alternative interpretation. The trace indicates the size of clock adjustment that when applied to the device(s) minimises the positioning error. Although ToF eliminates the clock offsets to a first order of magnitude improved positioning results may be achieve by applying a compensating clock offset. For ToF systems this chart shows the magnitude of the clock correction being applied.

knowhere anywhere
3rd Floor, St Andrew's House, 59 St Andrew's Street, Cambridge, CB2 3BZ, UK
tel: +44 1223 651390, email: info@omnisense.co.uk
Copyright © 2016, Omnisense Ltd