
2D Position Plot
2D Position Chart Overview
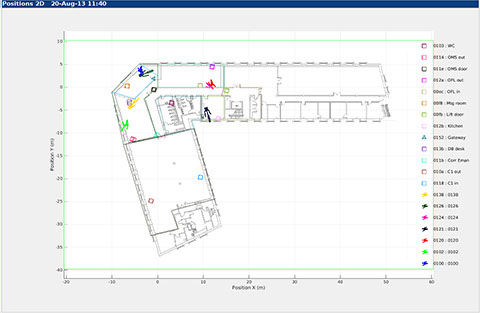
The 2D Positions chart shows a basic map-like view of the device positions. Positions are plotted using the local system coordinate frame (X, Y) with dimensions in metres.
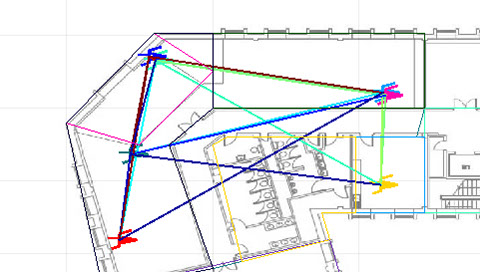
A map image can be set as a background - in the example on the right a floor plan has been used.
Zones are drawn as wire-frame outlines. In the case of the example on the right they have been defined to overlay the floor plan. However, they do not need to reflect the floor plan and can be defined entirely freely. Positions output by the system may be continuous positions or zone changes (occupancy).
Each node on the selected plot list is drawn with one of 11 different icons, and each is assigned a colour. The colours are selected to be as far from all others as possible in perceptual colour space making them easier to distinguish from one another. Up to about 20 colours can comfortably be distinguished on a good quality display monitor.
On the example to the right, mobile nodes are assigned the "walking stick man" icon, fixed nodes are a simple cube and the gateway is a tetrahedron. The icon is set manually in the current release.
A node key with Name is drawn on the right of the chart.
2D Position Chart Plot Options
The Position plots have more plotting options available than most of the other charts.
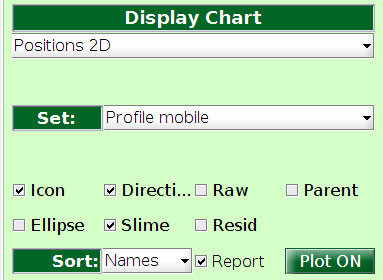
The group of nodes to display is selected using the "Set" drop-down. The lower examples on the right are all shown using the set called "Profile mobile". These are all nodes which have been configured using the profile named "mobile".
"Sort", "Reports" and "Plot ON" are the same as for other charts such as the Battery plot.
In addition the following plotting options are available:
- Icon - On or Off
- Direction - Show direction On or Off
- Raw - plot raw positions as well as output positions (indicated as small "+" symbol)
- Parent - show graphical link to parent device
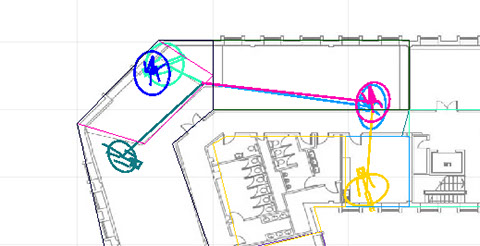
- Ellipse - overlay the estimated error ellipse for the current position
- Slime - draw a slime trail of recent device positions
- Resid - overlay those measurements showing greatest errors
Direction
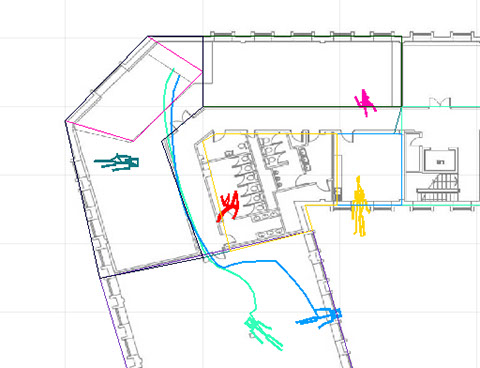
Computed positions include (X,Y,Z) position, velocity, orientation and other motion or behaviour related parameters. The direction indicator shows the node orientation in 3D. The "walking stick man" icon has good spatial characteristics. For example in the chart to the right the odinil (pale green) and cyan nodes are lying on their backs; the red and magenta nodes are standing up.
Raw
When raw position plotting is turned on each node has an additional small "+" symbol plotted at its raw position. This may be useful for fault diagnosis.
Parent
Within the hierarchy of the network each device has a parent. This is synonymous to the cellular basestation except that the parent can be any suitable node and does not need to be fixed or even stationary. When parent plotting is enabled lines are drawn linking each node to its parent.
Ellipse
Each computed position also has a computed quality metric and error estimate. The ellipse plot is used to show the estimated uncertainty in the computed position.
Slime
Slime trails can be used to show a trace of recent positions for the nodes.
Residuals
Residuals are the errors in the individual neighbour measurements used to compute a node's position. When turned on this plot overlays the largest residual errors onto the position plot. This may be helpful in tracking down set-up and configuration errors. It is also useful when displaying just fixed (anchor) node positions as an indicator of a good network set-up.
knowhere anywhere
3rd Floor, St Andrew's House, 59 St Andrew's Street, Cambridge, CB2 3BZ, UK
tel: +44 1223 651390, email: info@omnisense.co.uk
Copyright © 2016, Omnisense Ltd