Charts and Graphs
Description
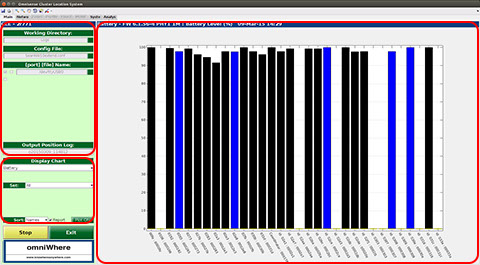
The Charts and Graphs display option is selected by clicking the tab labelled "Main" at the top of the screen.
On the left is the control area which is used to display system information at the top and below is a set of controls used to select which chart or graph is displayed and any display options applicable to it.
area on the right is used to display real-time information about the system, usually in graphical form.
At the bottom of the control area are "Start/Stop" and "Exit" buttons which are only used when running the omniWhere application in a stand-alone mode not on the whereBox.
Chart Window
The main display area on the right is used to display real-time information about the system in graphical form.
The area comprises a title bar for the chart being displayed and window within which the chart is plotted. The drop-down list for "Display Chart" is used to select which chart is displayed.
Controls
The control area on the left comprises:
- A section at the top used for system control and information. On the whereBox this area is provided for information only;
- A section below which is used to select the display chart and to set desired display options for the chart.


knowhere anywhere
3rd Floor, St Andrew's House, 59 St Andrew's Street, Cambridge, CB2 3BZ, UK
tel: +44 1223 651390, email: info@omnisense.co.uk
Copyright © 2016, Omnisense Ltd