Node Comms
Device Communications Performance
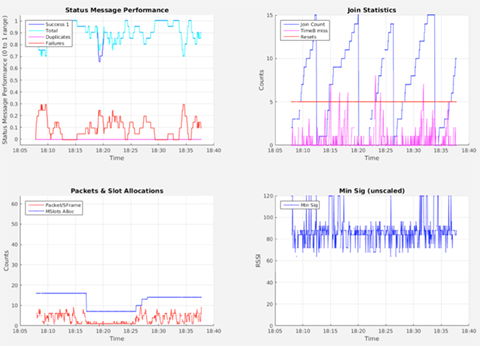
This technical chart is used to display a collection of performance statistics relating to the performance of the wireless network. Not all of the statistics are relevant to all network types.
The title of the chart includes the unique Device ID and date and time.
There are four sub-charts making up this plot.
Message Performance
This chart contains four traces showing:
- First Success (blue)
- Total Success (cyan)
- Duplicate Messages (magenta)
- Failures (red)
In each case the metric is represented as a proportion between 0 and 1, 0 = none, 1 = all.
Join Statistics
This chart shows information about devices joining the network; receipt of broadcast messages (TimeB) and stack resets.
Packet and Slot Resource Allocations
This chart contains information about allocated and used resources - it is applicable primarily to router nodes in the network.
Min SIG
This chart presents a time trace of the minimum signal level of correctly received messages from any neighbour. This is the same data that is plotted on the diagonal of the RSSI chart. It may be used as an indicator of device sensitivity to received signals and the levels of interference being experienced.
Communications in non-meshed Systems
The metrics displayed here related to both overall network performance and aspects of performance within meshed (routed) networks. In systems not supporting mesh networking or message routing, such as Nanotron swarm bee, the Resource Allocation chart has no meaning. In networks not supporting device authentication, such as Nanotron swarm bee, the Join statistics chart is not meaningful.

knowhere anywhere
3rd Floor, St Andrew's House, 59 St Andrew's Street, Cambridge, CB2 3BZ, UK
tel: +44 1223 651390, email: info@omnisense.co.uk
Copyright © 2016, Omnisense Ltd