Node Sensors
Node Sensor charts
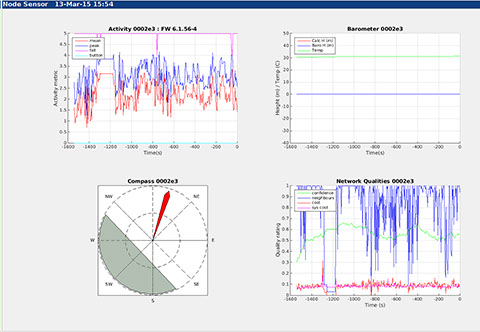
This chart displays various sensor and performance values for a single device. It is a compound chart comprising four smaller charts showing: motion, height, orientation, and network performance.
The chart title contains the name "Node Sensor", the unique device ID, the current temperature being reported by it and the date and time.
Activity (Motion) chart
This chart contains four traces showing:
- Peak activity level (blue)
- Average activity level (red)
- Suspected Fall incidents (magenta)
- Button presses or GPIO state (cyan)
The activity levels are derived from accelerometer measurements. This single value is derived as the logarithm of the norm of the (X,Y,Z) readings from the accelerometer chip. This makes the measurement orientation independent, and being logarithmic makes it easier to sense broad levels of movement. Values below about 1.5 correspond to a stationary device (fine discrimination within this can distinguish between body worn and not worn). Between 1.5 and 2.5 corresponds to light activity such as standing or gentle walking. Between 2.5 and 3.5 corresponds to walking or running. Above 3.5 corresponds to vigorous activity. Application specific interpretation may be used, also depending on where and how the device is worn.
Whenever a suspected fall is detected the fall line shows a momentary downward excursion.
Whenever the button is pressed the button line shows an upward spike. This trace alternatively shows status of GPIO1.
Height chart
This chart shows two height traces versus time for the recent past. The red trace indicates the system computed height (in the local coordinate system), and the blue trace shows the normalised barometer height. For devices without a barometer, or having the barometer turned off, the barometer height is the same as the computed height.
Compass
The compass chart is used to show 3D orientation using a bearing vector and artificial horizon.
The bearing vector shows the facing direction of the device relative to the X (horizontal) and Y axes - provided that magnetic deviation has been correctly set in the system configuration. Note that this is the facing direction of the device and not the direction of travel.
The artificial horizon shows pitch and roll relative to "level". Level is the plane that is normal to the gravity vector. The chart is most useful when the local coordinate system is defined such that the plane formed by the (X,Y) coordinates is level and Z is vertical.
For devices not fitted with a magnetometer, or for which the magnetometer has been turned off, the indicated orientation is static and has no meaning.
Network Qualities
This chart contains four traces:
- Confidence (green) - is a value between 0 and 1 showing how confident the system is in the position of the node. 0 = no idea, 1 = position is certain.
- Neighbours (blue) - indicates the proportion of nodes in the system used as neighbours to compute the position of the node being plotted. The value ranges from 0 to 1, with 1 being "all other nodes".
- Cost (red) - indicates the error in the position solution for the node. The higher the value the greater the likely error. Good values normally lie below 0.25.
- System Cost (magenta) - indicates the aggregated positioning error across the whole system. Good values normally lie below 0.25. A high value for the system error generally indicates some widespread systematic problem.
Node Sensor options
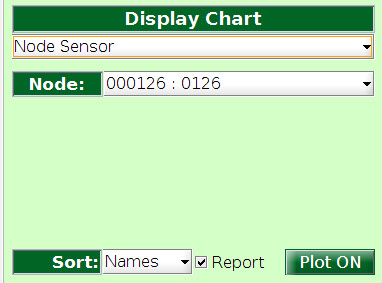
The plot is for a single device which is selected using the "Node" drop-down list.
The node list offered to the user is "all nodes" or "all reportable nodes" depending on the state of the "Report" option box.


knowhere anywhere
3rd Floor, St Andrew's House, 59 St Andrew's Street, Cambridge, CB2 3BZ, UK
tel: +44 1223 651390, email: info@omnisense.co.uk
Copyright © 2016, Omnisense Ltd