Battery Chart

Battery Chart Title

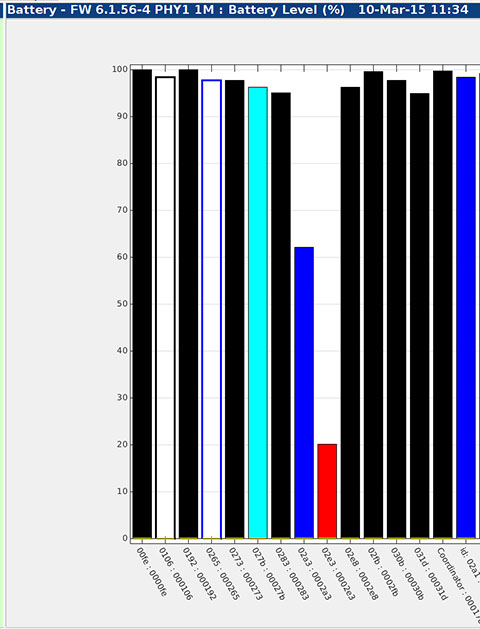
The title of the battery chart contains quite a lot of information about the system:

  • "Battery" indicates that it is a battery status chart
  • "FW 6.1.56-4" is device specific information that varies depending on the type of physical devices being used in the system
  • "PHY1 1M" is an indication of the physical radio channel and mode being used
  • Battery level is shown as a percentage of capacity remaining; depending on the device type battery may be indicated as a Voltage rather than a percentage.
  • The date and time on the right of the title indicates the time for the data displayed. On the whereBox this is usually its local time because the system is running live, but when running a Replay of previously recorded log data it indicates the time the data was captured.

Battery Plot

Battery level is plotted for each node as a bar. The bar value is according to the labels on the left axis of the chart area. Each bar is labelled with the Name of the node along the bottom.

Filled bars are for nodes that are running from their batteries. Open bars are for nodes that are  connected to an external power source. When the source of power is not known it defaults to indicating battery as the power source.

The colour of the bar indicates node status in the network:

  • Black - active node, GOOD battery
  • Red - active node, LOW battery (below 25% threshold)
  • Blue - some data loss, but node still reporting, GOOD battery
  • Magenta - some data loss, but node is still reporting, LOW battery
  • Cyan - node has not been seen for more than 1 minute, last battery status was GOOD
  • Yellow - node has not been seen for more than 1 minute, last battery status was LOW

Battery Plot Options

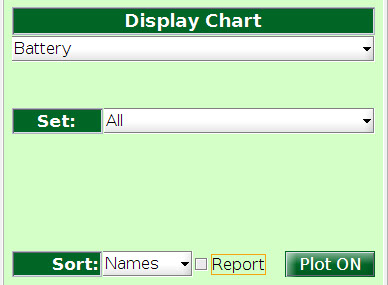
The pick list labelled "Set" is used to select which nodes are shown on the chart. In the illustration the list is "All". Other available lists include a list for each defined Profile, lists for each type of physical node, and a special list for low batteries.

Lists that are too long to fit on a single chart are divided into manageable lists, so that at most 100 Devices are shown on any one plot at any one time.

The "Low Batteries" list is ordered according to battery level with lowest first. This is very convenient as a way of reviewing which batteries are low and may need charging soon.

The "Sort" drop-down is used to order the nodes on the chart by "Name" or "ID".

The "Report" tick box is used to limit the display to only nodes that are "Reportable". The default is to show only reportable nodes. When the box is unticked all nodes are plotted.

The "Plot ON" button can be used to suspend data plotting. When clicked the plot is frozen and the button turns red. This can be used to stop live data plotting, for example while reviewing a particular plot.
3rd Floor, St Andrew's House, 59 St Andrew's Street, Cambridge, CB2 3BZ, UK

tel: +44 1223 651390, email: info@omnisense.co.uk

Copyright © 2016, Omnisense Ltd