3D Position Plot
3D Position Chart Overview
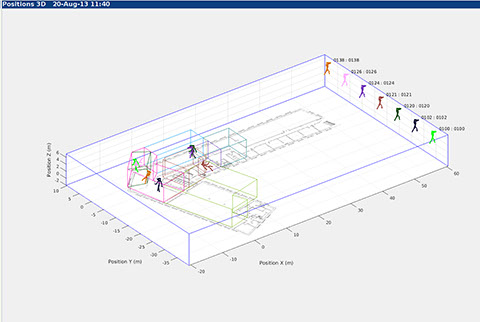
The 3D Positions chart shows a three dimensional view of the node positions. Positions are plotted using the local system coordinate frame (X, Y, Z) with dimensions in metres.
A map image can be set as a background - in the example on the right a floor plan has been used as an underlay at ground level.
Zones are drawn as wire-frame outlines. They show the three dimensional volumetric nature of the zones. Each zone is defined as a polygon in X and Y with constant height.
Each node on the selected plot list is drawn with one of 11 different icons, and each is assigned a colour. The colours are selected to be as far from all others as possible in perceptual colour space making them easier to distinguish from one another. Up to about 20 colours can comfortably be distinguished on a good quality display monitor.
On the example to the right, mobile nodes are assigned the "walking stick man" icon. The plot is being displayed for the "mobile" set of nodes.
A node key with Name and ID is drawn on the right of the chart.
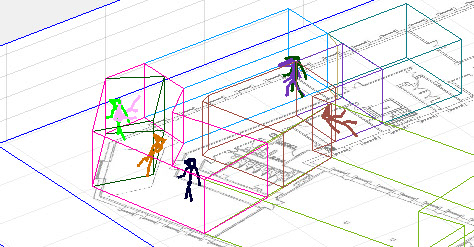
As can be seen nodes have clear 3D spatial orientation. The pink and brown ones are lying down, but the rest are standing. The "walking stick man" icon allows full 3D spatial orientation to be distinguished.
The 3D chart can be rotated, zoomed and panned using the icon toolbar at the top of the application.
3D Position Chart Plot Options
The 3D Position plot has slightly fewer plotting options available than the 2D position chart.
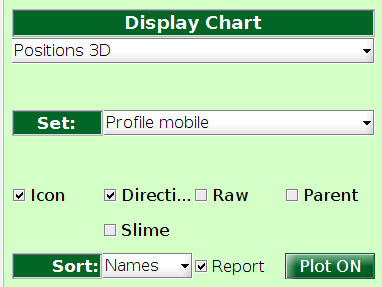
The Ellipse and Residual plots are not available. All other plotting options are the same as for the 2D chart but are rendered in 3D. See the description of the 2D Position Chart for details about the plot options.


knowhere anywhere
3rd Floor, St Andrew's House, 59 St Andrew's Street, Cambridge, CB2 3BZ, UK
tel: +44 1223 651390, email: info@omnisense.co.uk
Copyright © 2016, Omnisense Ltd