Network Chart
Live Network Chart
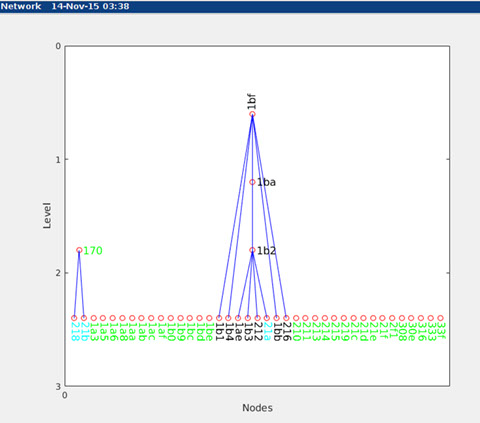
The network chart is a simple tree view of the device relationships within the network. The connecting lines show which devices are children and parents of which other device. This depicts the topology of the network.
Most networks have two different overlaid topologies:
- The positioning architecture that uses neighbour ToA (time-of-arrival) or ToF (Time-of-Flight) measurements to derive relative positions of devices. Any device may measure any other irrespective of where they are in the data hierarchy - provided that they are within radio range.
- The data-flow architecture in which measurements from nodes are sent back to the whereBox. Data is routed via the least cost path to the most appropriate gateway device (sometimes called an edge device or border router). A network may have multiple gateways. The gateways are at the top of the tree.
The network chart visualises the data flow structure of the network; the RSSI chart visualises the neighbour relationships as used for positioning.
Each device in the tree is labelled with its unique ID. The colour of the device ID indicates certain status attributes:
- black : normal operative active devices;
- green : devices that have never been seen or are not part of the network;
- cyan : devices that have not been logged for longer than 1 minute;
- blue : devices whose most recent blink was missed;
- red : devices operating normally, but which are running an older version of software;
- yellow : devices with old software that have not been seen for more than 1 minute.
Network Chart Options
The network chart does not have any configuration options.
An alternative view of the data flow architecture within the network can be displayed using the Position Charts by selecting the "Parent" display option.
The Signal Strength chart (RSSI) gives a view of the relationships between neighbours.

knowhere anywhere
3rd Floor, St Andrew's House, 59 St Andrew's Street, Cambridge, CB2 3BZ, UK
tel: +44 1223 651390, email: info@omnisense.co.uk
Copyright © 2016, Omnisense Ltd