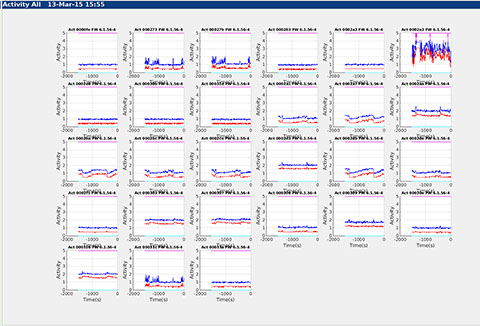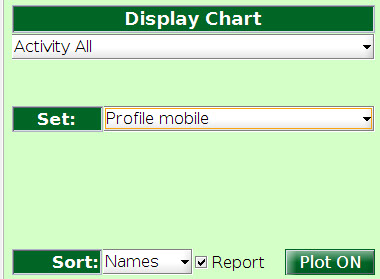
Activity All
Activity for multiple devices
This chart displays a set of charts, one for each device on the selected list as an array of miniature charts.
Each chart has the same format and interpretation as the Activity chart on the Node Sensor plot. The traces are peak activity; average activity, suspected falls and button press (GPIO)events.
Each chart has a title that includes the unique device ID.


knowhere anywhere
3rd Floor, St Andrew's House, 59 St Andrew's Street, Cambridge, CB2 3BZ, UK
tel: +44 1223 651390, email: info@omnisense.co.uk
Copyright © 2016, Omnisense Ltd