Charts
Chart Area
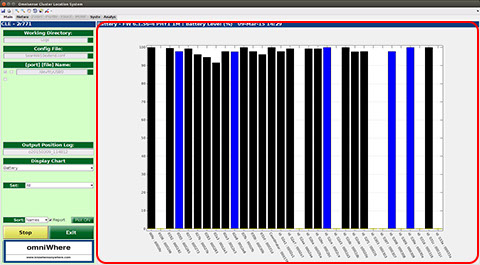
The main display area on the right is used to display real-time information about the system in graphical form.
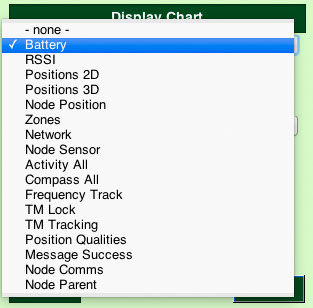
The area comprises a title bar for the chart being displayed and window within which the chart is plotted. The drop-down list for "Display Chart" (shown lower right) which is found in the Charts and Graphs control panel on the left of the screen is used to select which chart is displayed. The following real-time display charts are available:
- None - shows an empty window
- Battery Status
- RSSI - Signal Strength matrix
- Positions 2D plot
- Positions 3D view
- Node Position - position of single node
- Zones - chart showing zone occupancies
- Network - connectivity tree for network management
- Node Sensor - sensor plots for a single node
- Activity All - multichart view of activity for all nodes
- Compass All - multichart view of compass for all nodes
- Frequency Track - node clock tracking (frequency offset)
- TM Lock - Tracking status for timing model
- TM Tracking - Tracking errors for clocks in timing model
- Position Qualities
- Message Success
- Node Comms
- Node Parent
Controls available to tailor the display for each chart differ and are described with the documentation for the relevant chart. These controls are found in the area below the display chart selector.
Chart Options and Limitations
Not all devices in all configurations generate data to populate all the charts, therefore for some devices in some configuration some charts may not be available, or they may display null data. For example on Omnisense S500 devices the magnetometer (compass) may be turned off to save power and Nanotron swarm bee devices do not support a compass function, therefore in these cases the compass chart will not show meaningful data.
Limitations are covered in more detail in the detailed chart documentation.


knowhere anywhere
3rd Floor, St Andrew's House, 59 St Andrew's Street, Cambridge, CB2 3BZ, UK
tel: +44 1223 651390, email: info@omnisense.co.uk
Copyright © 2016, Omnisense Ltd