Node Position
Node Position Chart Description
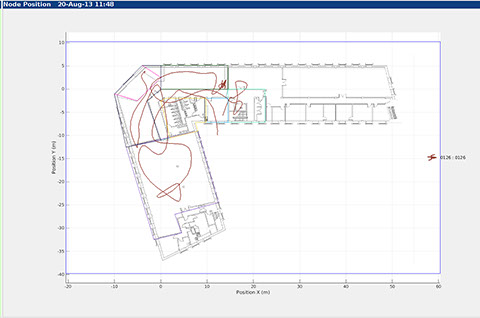
The Node Position chart shows a basic map-like view of a single device's position. Position is plotted using the local system coordinate frame (X, Y) with dimensions in metres.
A map image can be set as a background - in the example on the right a floor plan has been used - and zones are drawn as wire-frame outlines.
The device is drawn using its assigned icon.
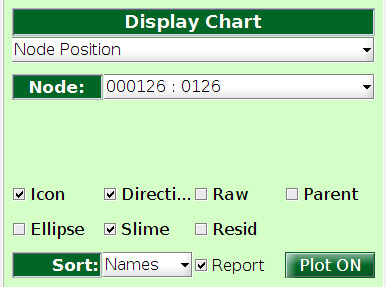
The device to plot is chosen from a drop-down list labelled "Node". The list displays the Name making it easily identifiable by the user. The list order is as per the "Sort" selection settable under the options. The list presented is filtered according to whether "Report" is ticked or not. When "Report" is enabled only reportable devices are included in the pick list and non-reportable devices are excluded.
The device Name is drawn on the right of the chart.
Plotting options are the same as for the 2D Position plot, although the default slime trail is much longer (shown in the example on the right).


knowhere anywhere
3rd Floor, St Andrew's House, 59 St Andrew's Street, Cambridge, CB2 3BZ, UK
tel: +44 1223 651390, email: info@omnisense.co.uk
Copyright © 2016, Omnisense Ltd